A runtime baseline before the Lua swap
This morning I published the plan to swap the console's Lua core for z8lua. The first rule I set myself in that plan: no cycle gets optimised blind. Which means before a single line of the new VM lands, Stage 1 is due - instrument everything, and write down the numbers the migration has to beat.
That was today. It produced a permanent benchmark instrument, two input tapes recorded from my own hands, one genuinely embarrassing class of bug, and a baseline table with a few surprises in it.
The instrument
The idea is simple and it stays simple: the firmware timestamps, the host does
statistics. A bench build emits one compact log record per frame over the
debug link:
2.792883 INFO bm f=1 st=1 lua=70043 up=7 dr=42444 fr=71364
                ac=960 hp=116852 hw=116972 an=2967 ab=245398 cyc=28017076
That is one line per present-loop frame: did the cart step this frame, the
whole Lua step, the _update/_draw split, the frame's work total, audio DSP
time since the last record, heap in use and high-water, allocator calls and
bytes, and a DWT cycle count around the step. The video link task emits its
own record per transferred frame (convert time, DMA window, frames it
skipped). Averages, medians, p99s and worst-cases are all computed on the Mac
from the raw per-frame records - the device never averages anything, so the
firmware cannot accidentally flatter itself.
The whole thing costs 808 bytes of flash and is compiled out of the production build entirely. The cart under test is baked into the ELF at build time, so a capture is reproducible from the image alone: same bytes, same cart, same boot.
One measurement I wanted and could not have: the Cortex-M7's DWT stall counters (CPICNT, LSUCNT and friends) are 8 bits wide. They wrap every 256 events, which across a 50-millisecond Lua step makes them dice, not counters. The honest substitute is an A/B run with the caches switched off - more on that below.
The console kept helping
The first capture measured the wrong thing entirely, and so did the second, and the third. Every one of these was the console working exactly as designed.
Unattended capture number one froze after ten frames with the Lua heap empty. The launcher had opened the cart library over the benchmark - because on this console the library opens at boot. That is the correct behaviour for a console. It is a disaster for a benchmark, because a frozen cart measures as an infinitely fast one.
Capture number two got further: the cart booted, ran ten real frames, then froze again. The log told the story:
2.321726 INFO cart: recognised "Solais (LD46 Compo)" (40473 bytes)There was a physical cartridge sitting in the cart slot - there usually is - and the slot engine had recognised it and raised its "load game?" prompt over the benchmark. I had restyled that exact modal a few hours earlier. It looked lovely, frozen there over my measurement.
Capture number three survived until 7.3 seconds in, when the WiFi manifest finished downloading and the launcher force-opened the library to show it off. Third door, same lesson. I stopped closing doors one at a time and pinned the whole thing: in a benchmark build, the overlay simply cannot interpose, whatever opens it.
The fourth one was subtler and it cost me a recording session. While capturing real Solais play, the game suddenly cut back to the Celeste title screen, mid-jump. The launcher was invisible - but it could still hear. A stray press of START had been walking an unseen menu, whose remembered cursor happened to sit on Celeste from earlier in the day, and the console dutifully downloaded it and hot-swapped it over my benchmark. The launcher is now deaf as well as invisible during captures, and I have a new respect for how much of a console OS exists specifically to interrupt you.
Tapes, not pokes
An unattended benchmark has nobody holding the controller, and a game benchmarked at its title screen is a lie of omission. My first pass was three scripted button pokes - enough to get past "press X" screens, but what it measures is a game standing still.
So the benchmark build grew a recorder. Every change of the button mask the cart sees is logged with its frame number; I played a minute of Celeste Classic and a minute of Solais on the pad, and a script cut each session into a tape - a tiny text file of frame/mask pairs:
# input tape from celeste-record.log: 229 edges, 5399 frames (90.0s)
1 0
1441 16
1452 0
1728 16
...
A replay build bakes the tape into the ELF and feeds it back, anchored to the cart's first frame:
pub fn inject_btn(frame: u32) -> u8 {
    let rf = frame.wrapping_sub(CART_F0.load(Relaxed));
    let mut mask = 0u8;
    for &(erf, emask) in TAPE {
        if erf > rf { break; }
        mask = emask;
    }
    mask
}
Every replay also re-logs the edges it plays, so a capture verifies byte-for-byte that the tape ran as recorded. The result is the best property in the whole system: two cold-boot replays of my Celeste run agree on the mean frame time to 0.06 percent. Real gameplay, as reproducible as a demo loop.
One trap worth writing down: tapes are measured in frames, capture windows in seconds. Under load this console's frame loop runs at about 51 fps, not 60, so my 86-second Solais tape did not fit in a 95-second window - the debug stream cut out with the last screens unplayed. The verification diff caught it immediately, which is exactly what it is for.
The numbers
Five reference carts, two cold-boot runs each, worst run-to-run disagreement 2.2 percent. These are the numbers the z8lua core has to beat - or at least not lose.
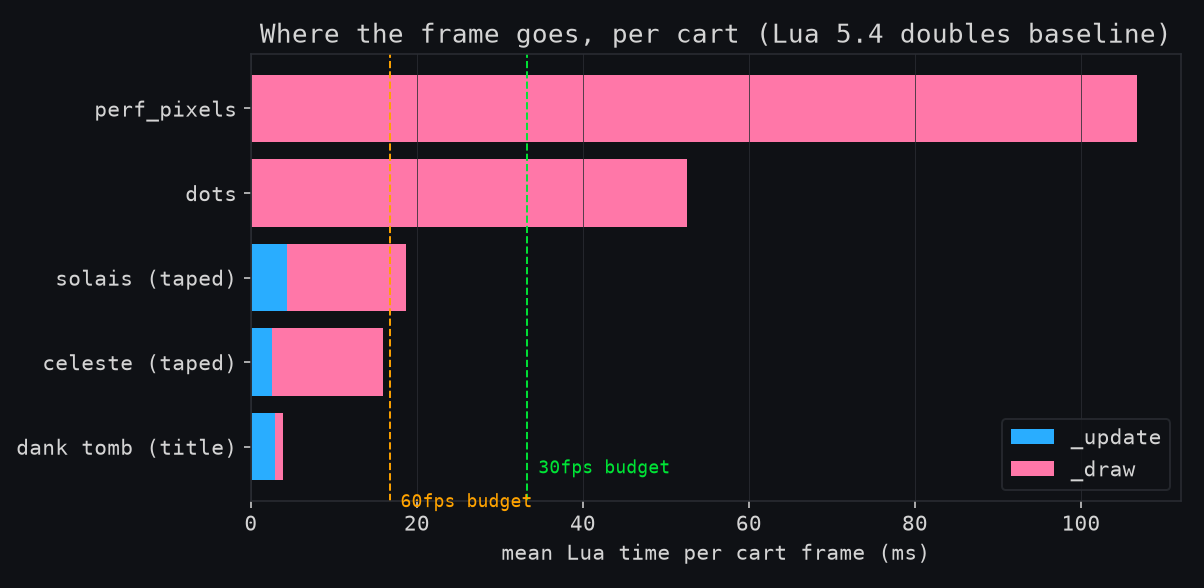
The shape is exactly what the earlier profiling suggested, now with numbers
attached. The games are fine: Celeste
Classic spends 15.9 ms of its
33.3 ms budget, Solais 18.8 ms of its 16.7 ms one (it declares 60 fps and
achieves 49.9 - the first quantified compatibility gap in a real game). The
demos are not fine: dots spends 52.5 ms per frame almost entirely inside
_draw, and perf_pixels - ten thousand sin/cos/pset calls per frame - takes
106.7 ms of pure interpreter. That last number is itself a correction: I had
been quoting 310 ms from notes taken before the native trig bindings landed.
Numbers rot; that is half the reason Stage 1 exists.
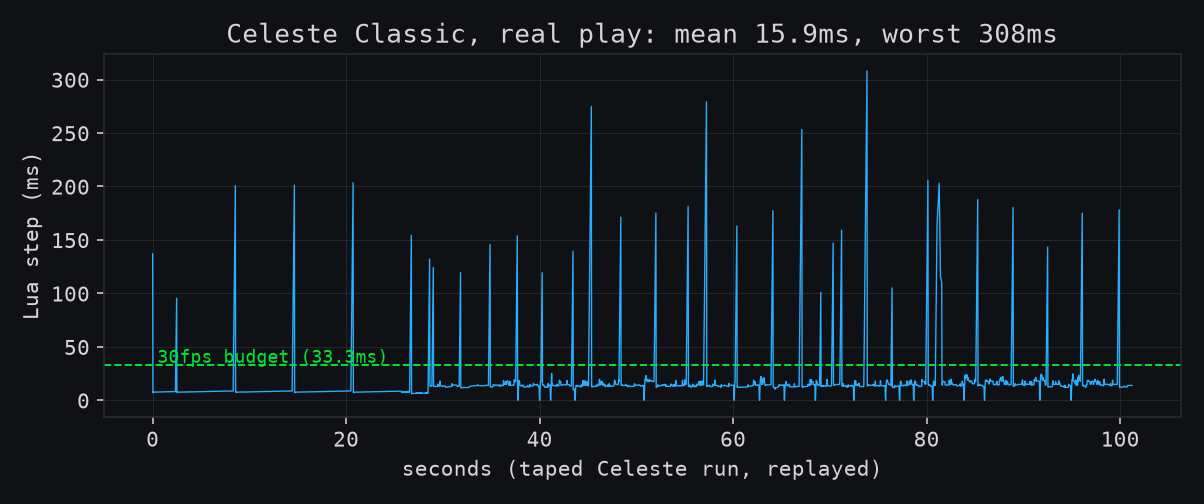
This one I did not expect. Celeste's frame time is a flat, comfortable line with periodic spikes to 100-300 ms - every couple of seconds, all run long, worst case 308 ms. That is a dropped-frames hitch, it is rhythmic, and I cannot yet attribute it: the prime suspect is the Lua garbage collector, but it could equally be the music tick or something in the cart itself. The migration plan's later stages replace the GC with one I can step explicitly, which will settle it. Until then it is written down as "bounded, not understood", which is at least honest.
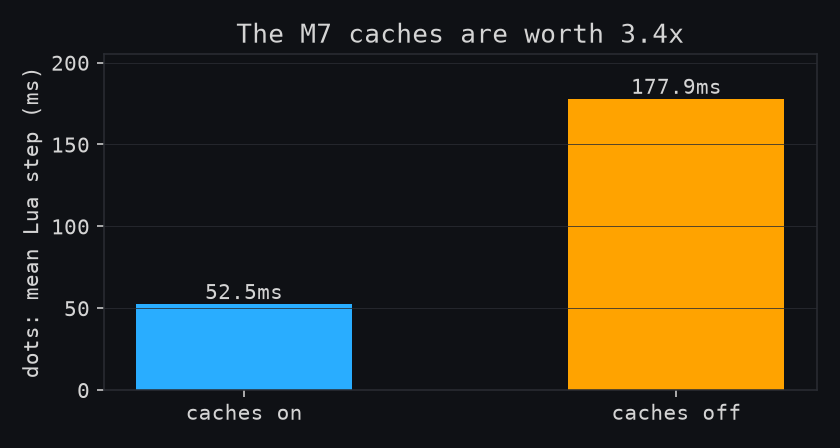
The cache A/B stands in for the stall counters the hardware would not give me: switch the M7's I and D caches off and the same cart's Lua step goes from 52.5 ms to 177.9 ms. A single 3.4x number that says most of what a cache-miss profile would.
And one finding that has nothing to do with the VM at all: the audio synthesiser costs about 30 percent of a core whenever music is playing (1.7 percent when it is not). I had been treating audio as a rounding error. It is not, and it now has its own line in the optimisation queue, independent of the Lua swap.
What this buys
The point of all of it: when the z8lua core lands behind its feature flag, its acceptance test is not "feels fine on the telly". It is this table, re-run, with three deltas published against today's commit - compatibility, memory, speed - and a rule that no reference cart gets slower beyond noise. The instrument is permanent; every stage of the migration reports through it.
Stage 2 is the vendor drop.