Profiling the SNES core on the H7
Rusty Nail is my fantasy console: an STM32H753 pretending to be a desktop, streaming a pixel desktop and a growing shelf of emulated machines out over HDMI. The console ladder so far has Game Boy, Game Gear, Master System, a Mega Drive that needed its frames delivered atomically, and an Amiga 500 that boots Workbench. The next rung is the SNES, and the SNES is the first rung that fought back on raw compute.
The target is fixed and non-negotiable: 60.09847 truly emulated frames per second, which at 480MHz gives a budget of 7,986,892 CPU cycles per frame. I hold the core to 80% of that, so the number that matters is a p99 of 6,389,514 cycles for emulation plus output preparation. Two weeks ago I measured an existing C emulator at 5.31 times over that line and concluded no amount of local tuning would cross the gap. The answer was a new core, written for this chip. Today that core became real enough to measure honestly, and the measurements spent the whole evening making a fool of my intuition.
Correctness first, and I mean cycle-for-cycle
A from-scratch emulator core is worthless until you can prove it against something. Mine is developed against LakeSnes (MIT licensed), vendored in-tree as an executable specification. Every component of the native core - the 65C816, the timing core, DMA, HDMA, the mode 1 renderer - lands only when it runs in lockstep with the oracle: same registers, same WRAM, same master-cycle count, same pixels.
Today the last gap closed. The validation run boots a Super Mario World cartridge image I own and free-runs it for 750 frames through the title and attract demo, hashing the framebuffer every 30 frames:
- 25 of 25 checkpoints pixel-perfect
- master-cycle equality at every checkpoint
- a separate lockstep harness stepping 12 million instructions with zero program-counter or cycle divergence
The final bugs were not one dramatic failure. They were a family of tiny timing details, and almost all of them were the same detail: the 65C816 samples its interrupt lines before the final bus operation of each instruction, not after. Pulls, pushes, branches that fall through, REP and SEP, every flavour of jmp, and immediate operands all have their own precise place for that check. Get one wrong and the CPU takes an NMI one instruction late, and 40 seconds into the attract demo Mario is standing somewhere else.
My favourite of the batch was the controller port. The fork hunter kept pointing at this loop:
$B978  lda $4017     ; serial pad port 2
       rol a
       and #$03
       beq ...
I had not modelled 4017 at all, so the read returned open bus. On real hardware the port is a shift register: the automatic joypad read drains all 16 bits at the start of vblank, and every read after that shifts out a 1. Super Mario World genuinely depends on those post-drain ones. Model the shift register, and the branch goes the right way.
The other class worth naming: two-cycle implied instructions do not just idle before their operation. If an interrupt is already pending, the idle cycle becomes a dummy read from the program counter, which costs whatever that memory region costs. The whole family routes through one helper now:
/// The oracle's cpu_adrImp for 2-cycle implied opcodes: the check
/// comes first, and a pending interrupt turns the idle cycle into a
/// dummy read from pc (which also costs that region's access time).
fn adr_imp(&mut self, bus: &mut impl Bus) {
    self.check_int();
    if self.int_wanted {
        self.mem_read(bus, self.pc_addr());
    } else {
        self.idle_bus(bus);
    }
}
Thirty-one opcodes, one shape, zero divergence afterwards.
Then the hardware got a vote
With every checkpoint hash matching the oracle, it was finally safe to ask the only question that matters: how fast does the real chip run this machine? I baked the ROM into a bench image at compile time, put the whole ~330KiB machine on a stack moved to the top of AXI SRAM, parked the audio coprocessor arena in D2 SRAM, and let the DWT cycle counter time all 750 frames.
[INFO ] frame=150 cycles=32271763 hash=0x4ae9fffd80b274a3
[INFO ] MACHINE frames=749 avg=29308861 p50=32235324 p99=36356326
The hashes printed by the board match the host run byte for byte, so the bench doubles as an on-target correctness probe. The numbers, though: 29.3 million cycles per frame on average against a 6.39 million gate. And here is the uncomfortable part - the old C emulator measured 33.96 million on this same board. I had rewritten the CPU, the scheduler, the DMA engine and the PPU from scratch, proven them cycle-exact, and bought barely 14%.
There was exactly one component the two worlds shared: the audio subsystem. My native machine still hosts the oracle's own SPC700 and DSP behind the four-port seam, because rewriting that is a later phase. Same C code in both measurements. Obviously the shared C audio core was eating the machine.
So I built an isolation bench: the audio bridge alone, advanced one frame's worth of master cycles at a time, nothing else running.
[INFO ] APU frames=32 avg_frame_cycles=2644980 min=2638296 max=27265792.64 million cycles. Inside its budget. Not the elephant. Hypothesis dead on arrival, and I am glad I paid the ninety seconds of board time to kill it rather than spending a week rewriting an audio core that was never the problem.
The follow-up A/B - the same journey run twice, second pass with the renderer switched off - split the remaining cost properly: roughly 14M of renderer and 12M of everything else. Two elephants, both in code I own.
Five levers, two of them real
What followed was the most honest optimisation session I have run on this project. Every lever got its own commit, every commit got flashed and priced by the board, and the board disagreed with me more often than not.
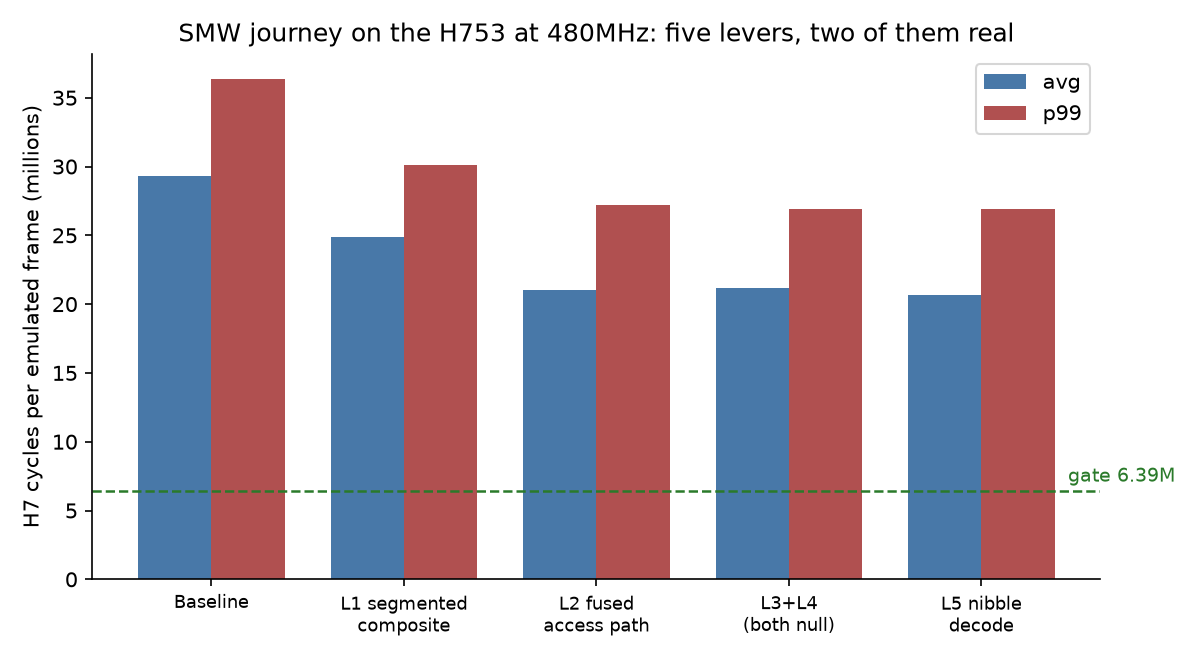
Lever 1, accepted. The mode 1 composite walked every pixel rebuilding a six-entry window truth table and re-dividing the brightness scale. Window state only changes at the four window edges, so the line now walks in segments with everything hoisted, and pixels whose winning layer has no colour math come straight from a palette cache. Average dropped 29.31M to 24.87M.
Lever 2, accepted. Every emulated bus access paid a DMA gate, a split clock advance, two event drains and an interrupt poll, even the overwhelmingly common case: a plain memory access inside a quiet stretch of the scanline with nothing pending. Those now take one fused branch:
// Fused fast path: a plain memory access inside the quiet window
// with no DMA or one-shot work pending needs none of the split
// advance, the DMA gate or the event drains, and the value read
// cannot depend on where inside the window it is sampled.
if is_plain_memory(address) && self.dma.is_idle() && self.sched.advance_quiet(time) {
    return self.mem.read(address);
}
The quiet-window arithmetic is identical to the exact path, so the lockstep harness still shows zero divergence over 12 million instructions. Average dropped to 21.03M.
Levers 3 and 4, null. A per-sprite geometry cache (the line scan re-derived size and position bitfields for 128 sprites on every one of 224 lines) and the same fused-clock treatment for the DMA engine's internal stepping. Both obviously good ideas. Both measured inside run noise. The M7 had already swallowed those costs whole - the scan I "fixed" turned out to cost 0.3M a frame, about 1% of the problem.
Lever 5, small. Spreading background plane bytes into nibbles once per tile row instead of extracting bits per pixel. Half a million.
Earlier this month I watched a lookup-table optimisation gain 12% on the host and lose 2.9% on the hardware, so this project already had a rule: the host never prices anything. Two nulls in a row extended the rule: neither do I. Time to stop guessing.
The profiler that renamed the problem
I put DWT cycle counters around the three renderer phases - sprite evaluation, background decode, composite - and let the board report the split at each checkpoint.
[INFO ] profile sprites=186699877 decode=1701121991 composite=4591105978Per in-game frame that is roughly 0.3M for sprites, 3.45M for decode, and 7.4M for the composite. Which sounds like "optimise the composite loop" until you divide by the pixels: 130 cycles each, for a loop that is maybe fifteen instructions long.
A fifteen-instruction loop does not cost 130 cycles because of arithmetic. It costs 130 cycles because it misses. The renderer's working set - 64KiB of VRAM, a 114KiB framebuffer, line buffers, palettes - is an order of magnitude bigger than this chip's 16KiB data cache. And the same lens snaps the other elephant into focus: the emulated ROM is half a megabyte sitting in internal flash, which at 480MHz answers a cache miss after seven wait states. The CPU side of the machine is not slow. It is waiting.
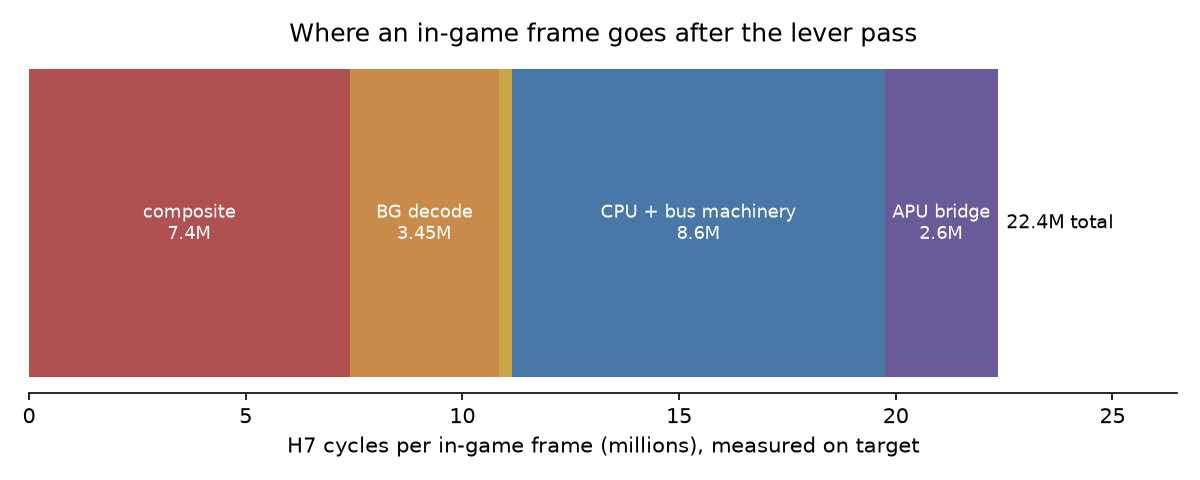
So the roadmap changed shape tonight. Not cleverer loops: memory placement. The H7 has 128KiB of zero-wait-state DTCM and 64KiB of ITCM sitting mostly idle while everything fights over one small cache. Line-hot buffers belong in DTCM, the dispatch core belongs in ITCM, the hottest ROM banks belong in real RAM, and every one of those moves gets flashed and priced individually, same as the levers - because if today taught me anything, it is that I cannot predict which of them matters.
Souvenirs from the bench
Two hardware lessons worth keeping. First, the measurement image runs the journey twice for the render A/B, and my first attempt constructed both machines in the same stack frame. Rust reserves a function's whole frame up front, two ~330KiB machines do not fit in a 512KiB stack, and the fault arrives as an imprecise BusFault inside clock init, long before either machine exists, with the stack pointer 316KiB below the bottom of AXI SRAM. Each pass builds its machine in its own function now.
Second, the frames in this post are not photos. They are the native core's own framebuffer, rendered on the host and written out at the exact checkpoints the hardware hashes - and because the board printed the same hashes, they are the hardware's frames too, bit for bit.


Where this leaves the mountain
avg 29.31M -> 20.64M p99 36.36M -> 26.91M gate 6.39MThirty percent recovered in an evening, and the remaining 4.2x is no longer a mystery. It is a short list of measured pools with names on them: 7.4M of cache-missing composite, 3.45M of decode, about 9M of bus machinery waiting on flash, 2.6M of audio bridge that gets a proper look once real game audio is keying voices.