Cattle Crisis from 9 fps to 58
Rusty Nail is my fantasy console: an STM32H753 running real PICO-8 carts bare-metal, out to a TV over HDMI via an RP2040 co-processor. The Lua runtime story is in why I didn't replace the PICO-8 runtime, and the heap saga starts in three by three and the heap that lied. This post is one long day of performance work, and it ends somewhere I did not expect: the single biggest lever was one line in a config file.
The symptom was Cattle Crisis, the shmup from the Lazy Devs tutorial series. Menus fine, music fine, then you press Start and the first level opens on a sky full of clouds. The FPS counter read 9. It crawled up through 10 and 15 as clouds despawned, and only reached 60 once the sky was empty. A fantasy console that drops to 9 FPS when the game starts is a paperweight with a nice boot animation.
The clouds are circles
A CPU sample over SWD pointed straight at circfill. Each cloud is a stack of
big filled circles, and the fill walked the circle octants pixel by pixel,
paying the full per-pixel price: clip test, palette remap, dirty-rect
bookkeeping. Around 108 circles were live in the opening sky.
Two changes. First, fill circles as horizontal spans and push each span through the same fast row writer that rectangles use. Second, deduplicate: the octant walk emits some rows twice (the cardinal points overlap), and the old code happily filled them twice. With spans deduplicated the fill cost dropped roughly in half, and the opening sky went from 9 FPS to holding 58 on the counter.
That was the catastrophic bug. It was not the interesting one.
The garbage the iterators leave behind
With the clouds cheap, combat still dipped into the 20-30 ms range per frame, and the trace showed the Lua allocator sprinting: hundreds of allocations per frame, then periodic emergency full collections that stalled a frame visibly.
The culprit was the compatibility prelude. PICO-8 gives carts all(),
add(), del(), foreach() - bare Lua does not, so I had been defining them
in a Lua prelude that runs before each cart. The Lua version of all()
allocates a closure plus three upvalue boxes per loop. Cattle Crisis runs many
all() loops per frame, one per entity list, so every frame manufactured a
little pile of garbage, and the GC eventually had to stop the world to sweep
it.
The fix is a C iterator with the same semantics, one compact allocation per loop, deletion-during-iteration included (that part matters - half the carts on the BBS delete entities mid-loop):
static int pico8_all_iter(lua_State* l) {
    int i = (int)lua_tointeger(l, lua_upvalueindex(2));
    size_t len = lua_rawlen(l, lua_upvalueindex(1));

    lua_rawgeti(l, lua_upvalueindex(1), i);
    if (lua_rawequal(l, -1, lua_upvalueindex(3))) {
        lua_pop(l, 1);
        lua_rawgeti(l, lua_upvalueindex(1), ++i);
    }
    while (lua_isnil(l, -1) && (size_t)i <= len) {
        lua_pop(l, 1);
        lua_rawgeti(l, lua_upvalueindex(1), ++i);
    }
    lua_pushinteger(l, i);
    lua_replace(l, lua_upvalueindex(2));
    lua_pushvalue(l, -1);
    lua_replace(l, lua_upvalueindex(3));
    return 1;
}add, del, deli, count and the rnd dispatch moved into C the same
way. The rnd one sounds trivial until you count: a single Cattle Crisis
explosion calls rnd() about 98 times. Explosions are the whole game.
While I was in the table code I also gave integer keys a fast path in the VM's table get/set/iteration, which had been round-tripping every index through a software double-to-64-bit conversion. Which brings me to the embarrassing part.
The flag
The H753 has a double-precision FPU. It is one of the reasons I picked the chip: the PICO-8 runtime does a lot of number conversion at the Lua/Rust boundary, and hardware doubles make that nearly free.
Except the firmware had been compiling for generic ARMv7E-M the whole time.
Without -C target-cpu=cortex-m7, LLVM does not assume the FPU's double
instructions exist, so every coordinate conversion at every API binding was
calling a ~100-byte software helper. Thousands of times a frame. On a chip
with silicon that does it in one instruction.
One line in the cargo config:
rustflags = [
    "-C", "target-cpu=cortex-m7",
    ...
]
And the disassembly after:
8005ae0:  eeb8 1bc1   vcvt.f64.s32  d1, s2
8005ae8:  eeb8 2bc2   vcvt.f64.s32  d2, s4
The final binary has 293 vcvt instructions where there used to be library
calls. I re-ran the same recorded input and the whole frame profile shifted
down. Weeks of careful per-function optimisation, and the fattest win of the
day was a build flag. I am telling you this so that when you bring up a
Cortex-M7, you check your target-cpu before you profile anything.
Measured, not vibed
Manual "play the level while I watch" testing bit me once during this session: a comparison run looked wrong until I realised the controller input was being ORed into the replay, so my second run had quietly diverged from the tape. Replay builds now ignore the pad entirely, and every A/B below is the same recorded Start press replayed against the same embedded cart.
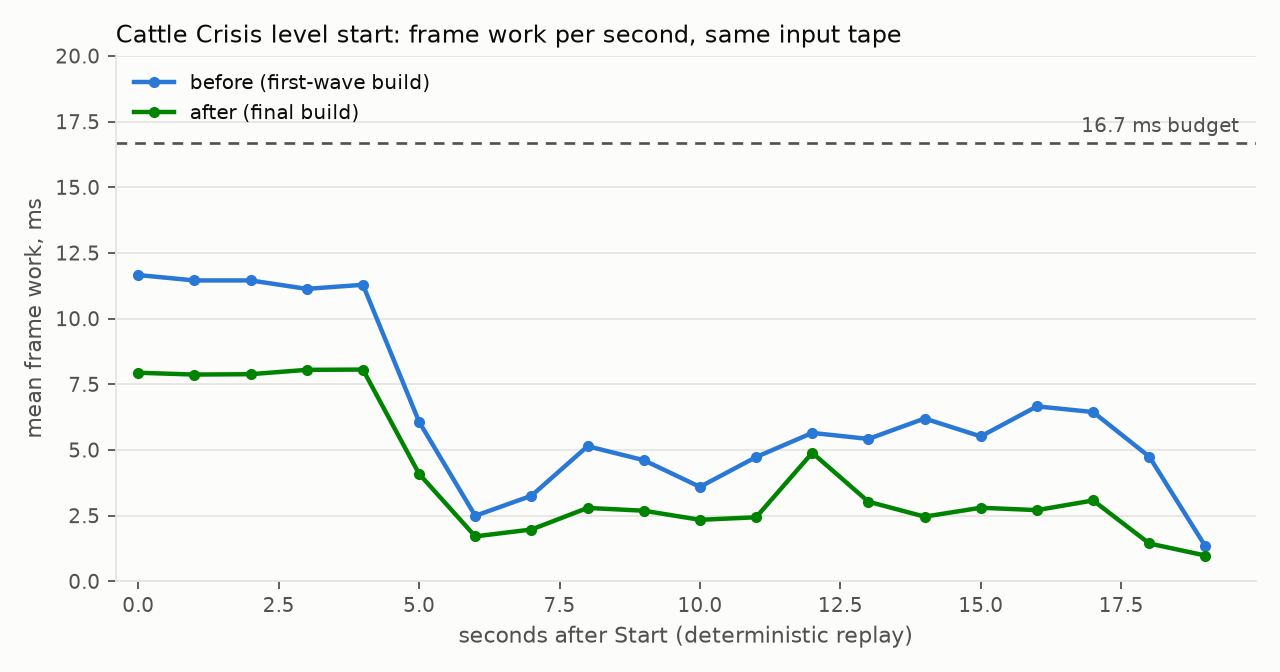
Mean frame work per second over the level start, same input tape. "Before" is the build that already had the circfill span fix - the original 9 FPS build predates the capture tooling and lives only in my memory and the commit log. The first five seconds are the cloud wall; both builds are under the 16.7 ms budget, but the after build has twice the margin.
The rest of the sweep, quickly: the common 8x8 unclipped map tile got its own blit path (a map call fell from ~479 us to ~285 us), the PICO-8 surface stopped doing dirty-rect bookkeeping nobody consumes (carts repaint every frame anyway), the per-draw profiler is compiled out of production builds (it was timestamping every sprite), and two chatty log sites came out of the hot path, including one in the audio interrupt.
One negative result for the record: compiling the firmware for speed instead of size (484K -> 666K of flash) measured a frame-time change of approximately nothing, and I reverted it. The hot loops were already hot; the other 180K was just cache pressure with a bigger address.
Where it lands: the level start holds 57.7-58.7 producer FPS with zero frames over budget in the deterministic replay, and sustained combat sits at 56-58 on the screen. The residual ceiling is the DVI link's ~59 unique frames per second, which is a wire problem for the PCB era, not a Lua problem.
The wall moves
Every session here has a second act where a different cart objects. Today it was Dank Tomb, Krajzeg's lighting-engine dungeon crawler (it is on itch, buy it), which had been living happily in the library and now died of out-of-memory about 20 seconds into play.
Nothing about my perf work leaked memory - the trace showed the same live-set size as before. What changed is that Dank Tomb was always brushing the ceiling, and today's session kept restoring it at exactly the wrong moment. The heap has ~535K of physical TLSF space across its regions, and Dank Tomb's first level retains enough that allocator overhead on thousands of small objects could push the peak over the edge.
Two general fixes, no cart-specific anything:
First, carts now compile to stripped bytecode before the play state loads them. Lua keeps parser-side debug metadata (line tables, local names) attached to every function prototype for the life of the chunk; dumping the compiled chunk with the strip flag and undumping the result drops ~46K of physical heap for a cart this size. The stripping pass runs in a bounded scratch buffer that borrows the Game Boy emulator's arena, which is idle by definition while a PICO-8 cart is loading:
eth cart: fetched 51372 bytes over Ethernet -> hot-swap
cart chunk stripped: 29843 bytes source -> 52082 bytes bytecode in 35ms
cart chunk UNDUMPED in 3ms (52082 bytes bytecode)
pico cart running (60 fps)
(Yes, the bytecode is bigger than the source. Byte count is not the point - the stripped chunk holds no prototype metadata, and metadata is what was bloating the resident heap.)
Second, the same idle arena now backs a last-resort pool for fixed-size Lua objects, tried only after every normal heap region is full, torn down with the Lua state before any Game Boy launch. Table headers - the dominant small object - get a protected slice of it. The normal allocation path is completely unchanged; the pool exists only past the point where the old build was already dead.
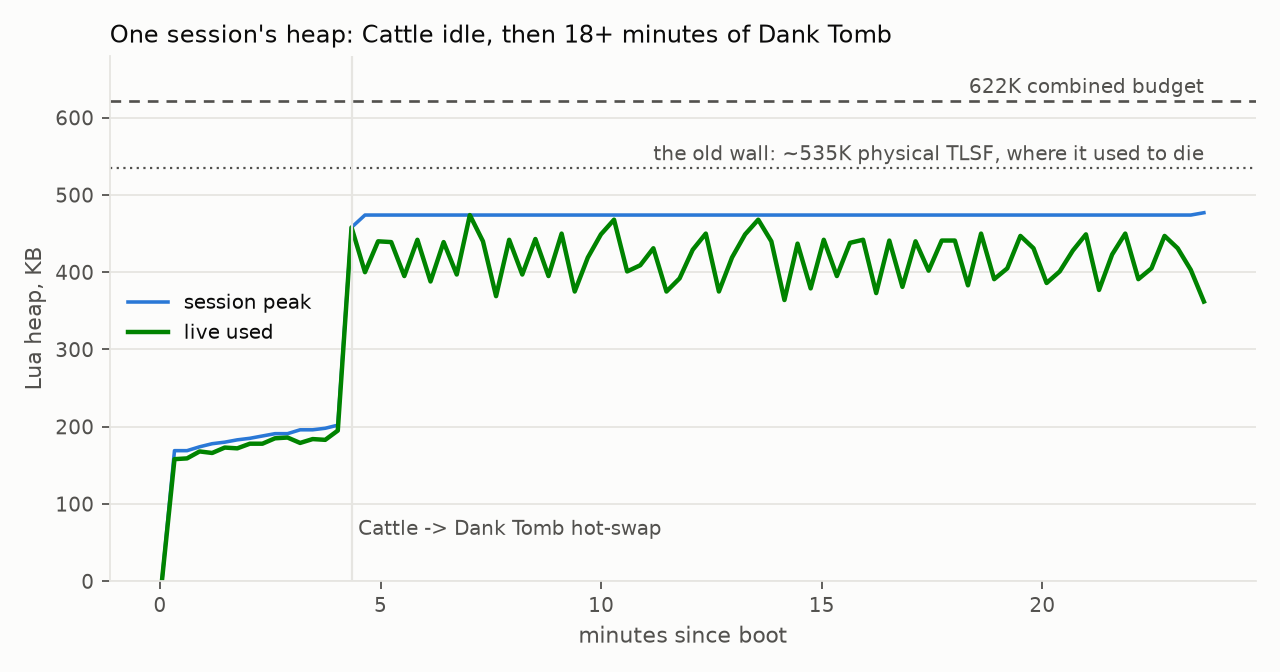
One live session off the device's own telemetry: Cattle Crisis idling around 180K, the hot-swap to Dank Tomb, then 18+ minutes of play oscillating around 400-450K with the session peak pinned at 474K - comfortably past the ~535K wall where this cart used to die, with zero allocation failures.
Two ghosts on the way out
Two debugging stories from the same day, both worth keeping.
The first: mid-session my log stream showed a panic from the async executor
and an out-of-memory error, seconds apart. Neither was real. The ST-LINK had
dropped its SWD connection earlier (it did that a lot today), and re-attaching
the log reader mid-stream joined the byte stream misaligned - defmt frames
decoded against the wrong format strings, manufacturing plausible-looking
lines. The tell, once I cross-checked the claimed source locations against the
actual code: a "cart name" logging as 10240, a boolean rendering inside a
hex address as base=0xtrue, and a periodic line arriving every 17.09 seconds
- which is exactly 1024 frames at 59.94 FPS, i.e. my own heap telemetry wearing someone else's format string. A fresh flash-and-run restored an aligned stream and every ghost vanished. Lesson: after a probe drop, a surprising line in an attached log stream is not evidence until it reproduces from reset.
The second ghost was real. During the Dank Tomb testing the library refused to load: the launcher sat on its 2-cart built-in list, no manifest, forever. The manifest normally arrives over WiFi from the ESP32, with an Ethernet fallback that fires after 6 seconds if the ESP reports WiFi down. Today the ESP wedged completely - not even status frames - and that exposed a structural bug: the launcher loop's periodic work (including the fallback deadline check) only ran when a byte arrived from the ESP. Silent ESP, parked loop, starved fallback, empty library. The whole failure was one unbounded read:
// before: parks forever when the ESP goes quiet
if esp_rx.read(&mut byte).await.is_err() {
    continue;
}

// after: the loop beats at least once a second regardless.
// BufferedUart RX is a ring buffer, so the cancelled read loses nothing.
match with_timeout(Duration::from_secs(1), esp_rx.read(&mut byte)).await {
    Ok(Ok(_)) => {}
    Ok(Err(_)) | Err(_) => continue,
}
With the timeout in place and the ESP still dead, the fallback fired right on schedule and the library loaded over Ethernet:
6.056805 eth fallback: WiFi down, GET manifest http://192.168.2.1:8123/manifest.json
6.082762 eth fallback: manifest loaded over Ethernet, 33901 bytes, 323 carts
323 carts, 26 milliseconds. The console now survives its own co-processor dying, which feels like the kind of thing a console should do.
The scoreboard
- Cattle Crisis level start: 9-15 FPS -> 57.7-58.7, zero frames over budget
- Sustained combat: 56-58 on screen, bounded now by the DVI wire, not the CPU
- One map call: ~479 us -> ~285 us
- Dank Tomb: OOM at ~20 seconds -> 18+ minutes and counting, peak 474K of 622K
- Software double conversions: gone, 293 hardware
vcvtinstructions instead - Speed-optimised build profile: measured worthless, reverted
- Phantom panics believed: briefly, once
The engine work is converging. What is left between here and a true 60 on screen is the link budget, and that is a hardware story - the PCB that replaces my jumper-wire nest is where the wire ceiling lifts. The clouds, at least, are no longer the problem.