A phone app for the dashboard panel
The mirrors fold now, which means the project has proved it can read a control unit, change it, and verify the change. What it does not have is a way to use any of that without a laptop and a serial console.
So these two days were about the two screens. The ESP32-P4 panel that holds the OBDLink CX connection and does all the diagnostic work, and a Flutter app on an iPhone. Two angles on one product, where the interesting decisions turned out to be about which of them owns what.
The phone does not talk to the car
My first instinct was the obvious one: the phone speaks Bluetooth, the adapter speaks Bluetooth, so let the phone talk to the adapter directly. I corrected that before it cost me anything, and the reason is worth stating because it shaped everything after.
The adapter accepts one connection. Every piece of state that matters lives behind it: which TP2.0 channel is open, whether a login is live, which single-shot experiment journal has been consumed. If the phone could reach the adapter on its own, then two clients could each believe they owned the car's bus, and the interlocks I spent the previous day building would be enforced in one of them and not the other. The panel owns the adapter. The phone talks to the panel, which makes it a view of the panel's state and a way to ask it for things, and leaves it unable to send a diagnostic request the panel has not agreed to.
That makes the link between them a protocol rather than a pipe. Version 2 of it carries the adapter's supply voltage in tenths, the vehicle profile name when the VIN matched one, the panel's connection states, and the four experiment journals classified read-only from the panel's own storage. The phone refuses a version 1 body outright and parses every field fail-closed. A value it cannot read becomes absent rather than a default, because a default is a lie the interface will happily draw.
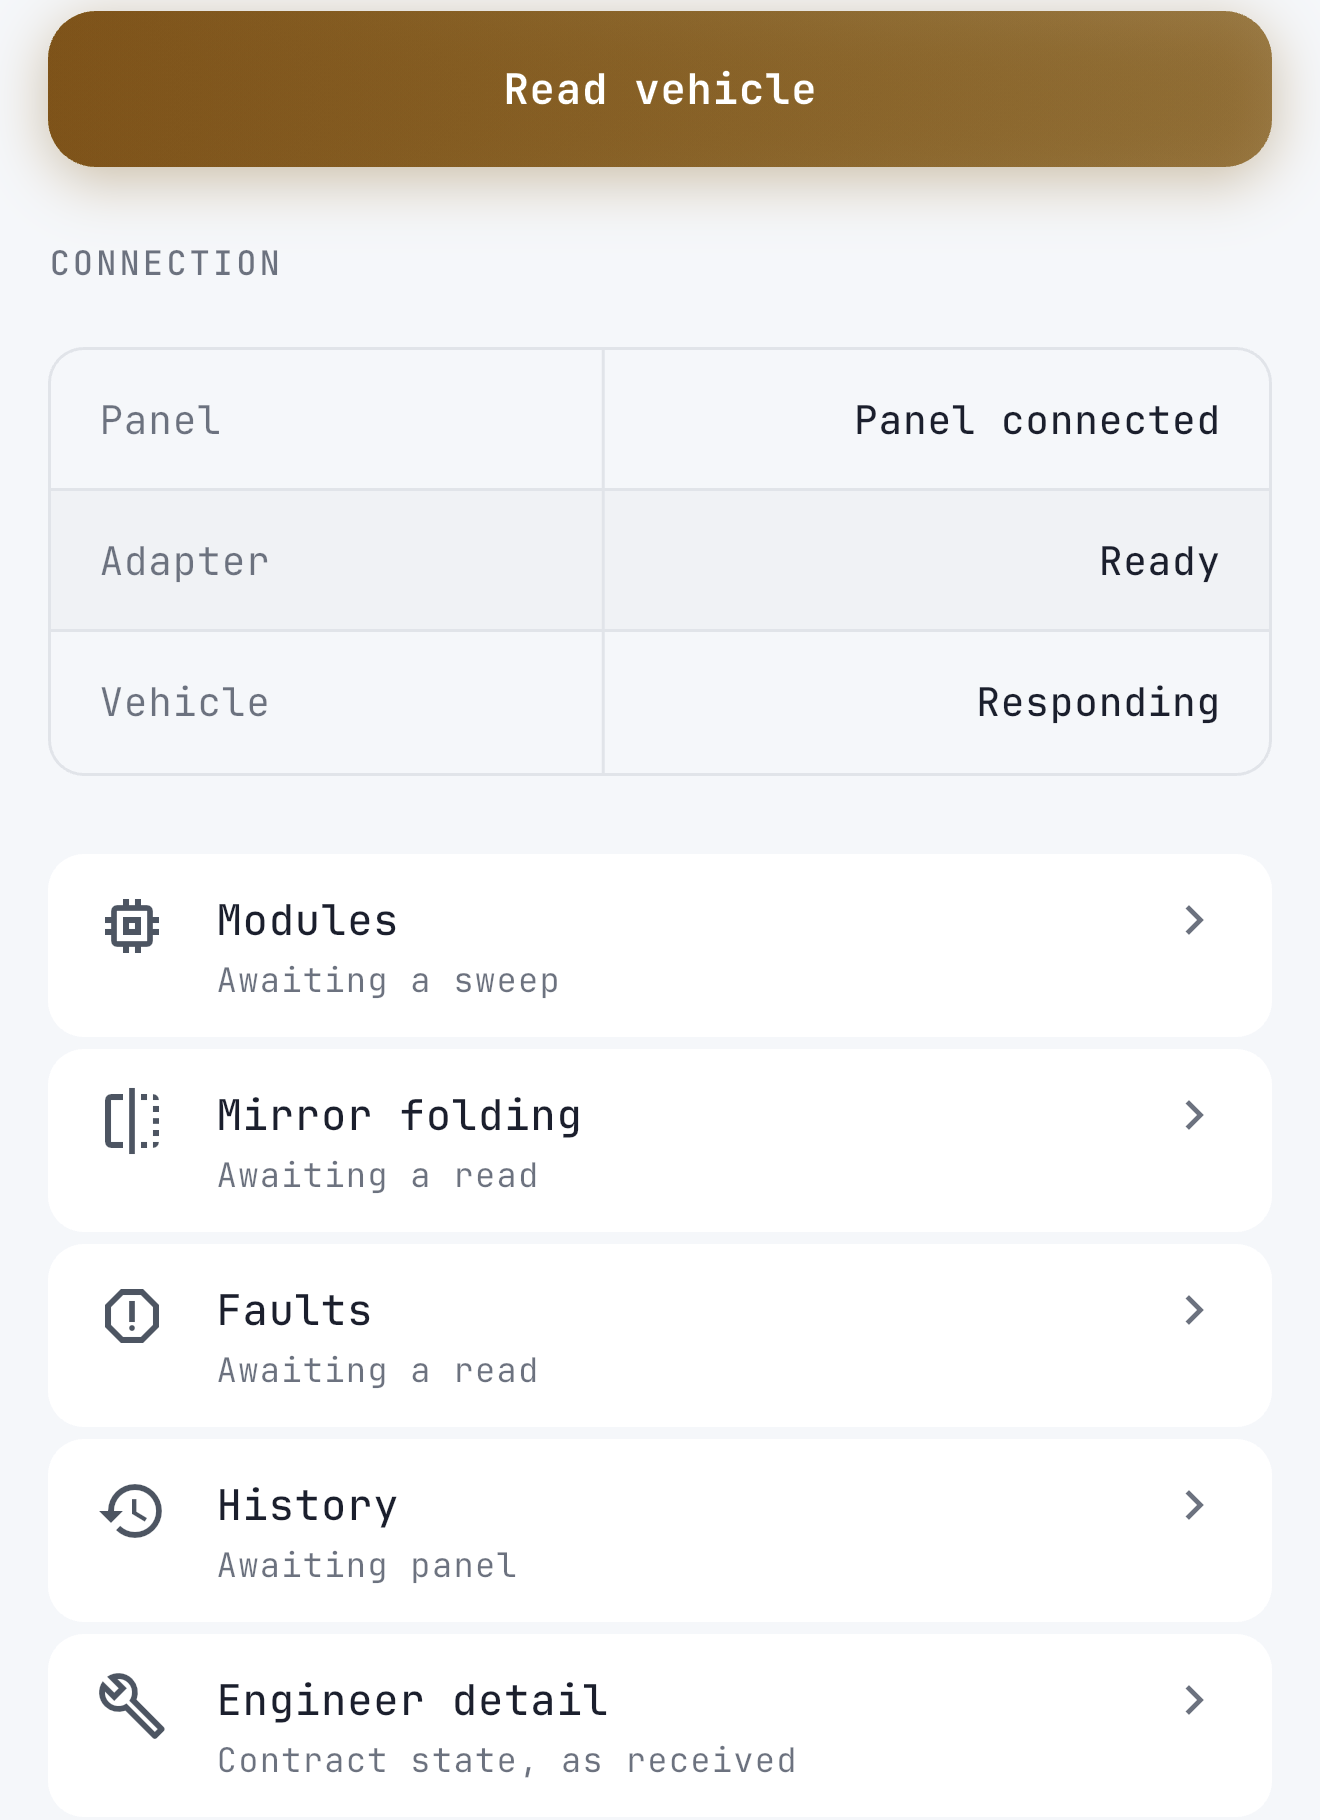
Pairing is a QR code on the panel. The phone reads it, joins the panel's network, and pairs with the six digits in the passphrase. Later that second day I added Bluetooth as a second transport with the same framed operations over it, so the link survives without Wi-Fi at all, and the panel's Wi-Fi went off by default behind a console command.
Why the panel ran at fifteen frames a second
The panel felt sluggish and I had no numbers, so I added counters to its own render loop: time spent building a frame, time spent inside present, and the interval between the starts of consecutive drawn frames. One window from boot, idle on the Home page:
[frames] drawn=815 skipped=0 render avg=16000 max=24358 us,
         present avg=43472 max=53474 us, interval avg=68251 us
Forty-three milliseconds inside present, against sixteen to draw the thing in the first place. The panel was spending nearly three quarters of every frame waiting, because present blocked for two refresh boundaries and then copied the finished frame back, and it did that whether or not a single pixel had changed, since the loop drew unconditionally.
Every frame. On an idle screen.
Three changes came out of that. Present now hands the buffer over and returns, with the wait for the retiring buffer moved to just before the next draw and paced by a frame counter in the refresh interrupt. Idle frames are skipped entirely by hashing the scene. Animation frames are paced by the panel's own refresh rather than by a sleep.
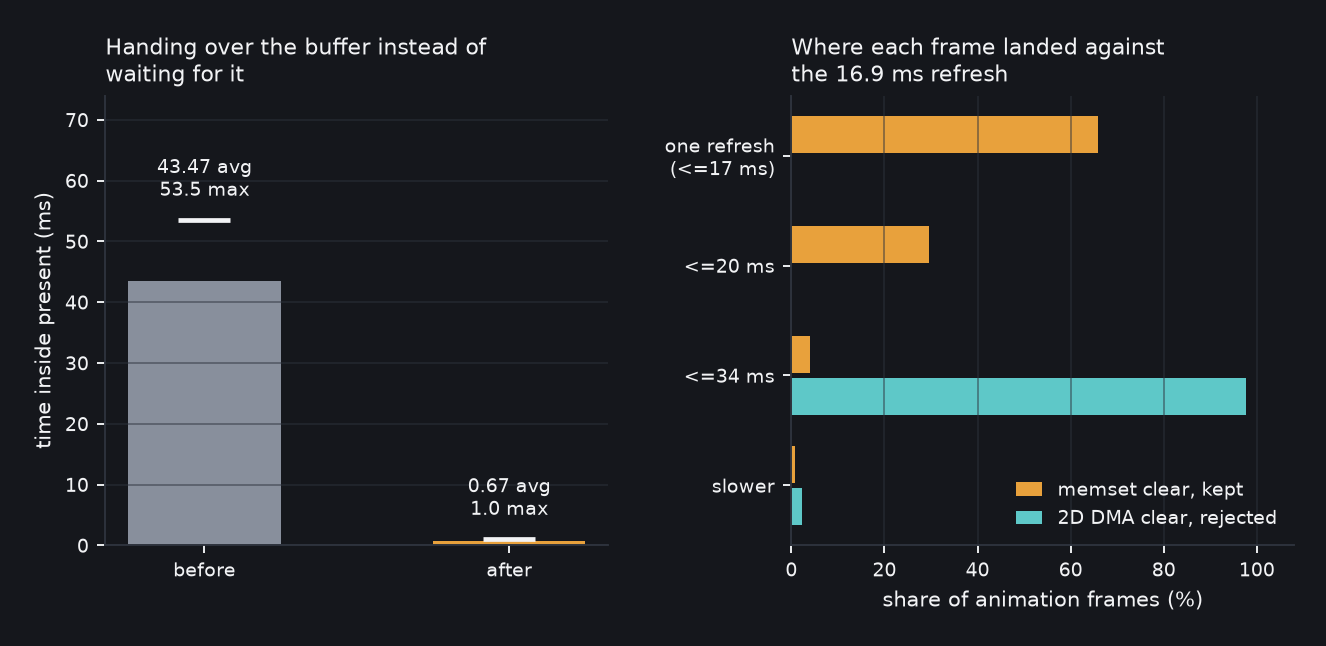
Present went from 43.47 ms average to 0.67, with a worst case of 1.0 ms against the old 53.5. More useful than the average: of 278 animation intervals, 183 landed inside one refresh and 265 inside two, which is the panel drawing as fast as its own hardware retires buffers.
The clever version that was slower
With present fixed, the whole-screen clear was the biggest remaining cost at about 6 ms of the render. The P4 has a 2D DMA engine, so the obvious move is to let it clear the next buffer while the CPU draws the current one. I built it: three framebuffers, an async memcpy of a template frame into the buffer that retired a frame earlier.
The CPU side of the render fell from about 14 ms to 5.5, which looks like a win until you time the DMA. The megabyte copy took 18 ms, longer than the 16.9 ms refresh, so every animation frame had to wait for it and the pacing went from one frame per refresh to about 25.7 ms. Not one animation interval landed inside a refresh. That is the teal row in the figure above, and it is why the driver went back to a plain memset.
The thing I would have got wrong without measuring is that the CPU number improved exactly as predicted. If I had stopped at "render time halved" I would have shipped a panel that animated at 39 frames a second instead of 57 and congratulated myself.
Touch, on its own schedule
The same blocking present had been poisoning the digitiser. The loop sampled touch once per frame, and since a frame took about 67 ms, a finger dragging across the glass was sampled about fifteen times a second. Drags stepped coarsely no matter how I tuned the gesture filter, because the data was not there to smooth.
Touch now runs on its own FreeRTOS task at 20 ms, and every sample carries the time it was taken. The loop drains the whole queue each frame in order, and the shell times gestures from each sample's own stamp rather than from when it got around to reading it. So a burst drained after a long frame still has the finger's real spacing in it. Measured on the glass: 269 intervals at 20 or 21 ms, and a full slide tracked continuously.
Dials, because a number is not a gauge
With frames cheap the panel could afford a dashboard. It reads live mode 01 telemetry and draws it as cluster dials rather than as a table of numbers: an arc that opens at the bottom with zero at eight o'clock, scale numerals at the ticks, and the readout with its unit sitting in the opening. Every position inside the ring is derived from a numeral's edge plus a fixed clearance rather than from a magic offset, which meant the layout survived changing the font.
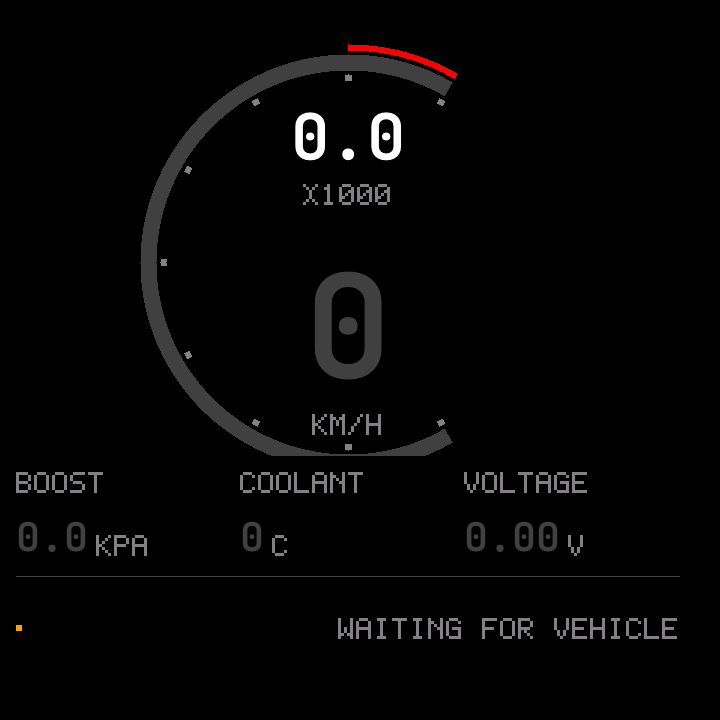
Widgets keep a peak: the highest reading so far, marked where the needle reached and shown as a number beside it. It is on for boost by default, which is the one I actually wanted.
Three stack overflows happened along the way and all three were the same shape. The loop task ran on an 8 KB stack, and things kept getting built on it: a quarter-second snapshot that had grown to several kilobytes, then a configuration document parsed into a temporary, then an appearance model that deepened the render path. Each one reset the panel. The fixes were to build in place into statics and, eventually, to give the loop 32 KB.
The fourth was caught by a segfault in CI rather than on hardware. The expanded gauge view drew a copy of a layer instead of naming the page's layer explicitly. The copy's address, interpreted as an index into the page's layer array, came out at -320, so the draw wrote past the sprite into whatever was there. On the panel that is a silent corruption; under the host test suite it is an immediate crash. I have never been so glad to have the renderer compile and run on a desktop.
The panel's screen, on the phone
The last piece is the one I expected to be hardest and was not. The phone can show the panel's actual screen: the panel sends its framebuffer as lossless run-length frames over the link, the phone draws them scaled, and a tap or a drag on the picture is replayed into the panel at the same panel pixels. A drag is sent as the recorded finger path with its timing, not as a start and an end point, so the panel's own gesture filter sees something that looks like a finger.
Nothing on that page redraws the panel's interface a second time. It is the panel's pixels, which means it cannot drift out of sync with what is actually on the glass.
Fifteen codes from one battery disconnect
The battery had been off the car earlier that day, and the dash came back lit: the stability control lamp, the yellow steering wheel, a tyre pressure warning. So the fault read had a real job.
The panel sweeps every module that answered the TP2.0 discovery and asks each
for its stored codes. My first attempt asked with status byte 00, and every
module except the gearbox refused that outright. Asked as 18 02 FF 00
instead, every one of them answered.
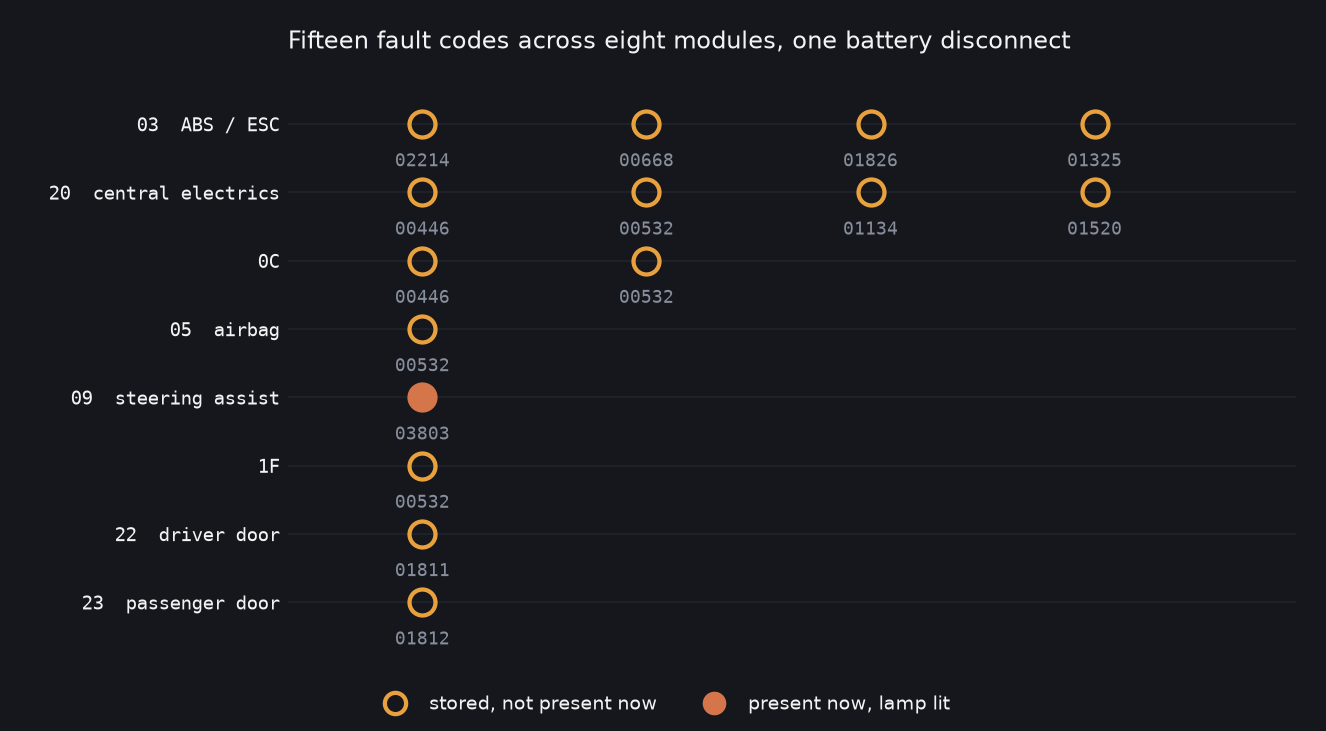
Fifteen codes came back, spread across eight of the thirteen modules, and the pattern in them is not subtle: 00668 is supply voltage terminal 30, 00532 is supply voltage B plus, 00446 is function limitation due to under-voltage, and the two door controllers each logged their own version of it. Every stored code is one event seen from a different seat in the car. That is precisely what the Ross-Tech page for 00668 says to suspect when the number turns up in several modules at once.
One code is different. The steering assist holds 03803, no or incorrect basic setting for the steering angle sensor, and its status byte says present now with the lamp lit. That one is not a memory of the disconnect. The steering angle sensor lost its calibration and wants a basic setting, which is why the yellow steering wheel is still on the dash while the others are stored history.
Worth being careful here: the fault numbers are the two code bytes read as a decimal the way VAG testers show them, and the status byte is read as ISO 14230-3 bits over a VAG fault-type number. The texts come from the Ross-Tech wiki, except 01811 and 01812 which I could only find in forum scans. The addresses are the TP2.0 logical addresses, which are not the addresses a VCDS scan shows, so I name each module by the part number it gave me rather than by an address mapping I would have to assume.
Where it stands
The panel draws at its refresh, owns the adapter, holds a dashboard and a fault inventory, and can be driven from the phone's screen. The phone shows the car's state, requests reads, and cannot originate anything the panel has not agreed to.
The fault read is the first genuinely useful thing this project has done that was not about itself. It told me what the disconnect cost and what is still wrong, and the remedy for the steering angle sensor is a basic setting this build cannot perform.