Why the game library ran at 15 fps on the dashboard
Clutch Cargo is a Volkswagen MIB2 head unit that runs a game library on its dashboard. The panel is 800x480, the operating system is QNX, and the frontend is ES-DE cross-compiled for ARM QNX with emulator cores behind it. A USB controller drives it.
Browsing that library ran at about 15 frames per second. Moving between systems looked like a slideshow. The library is 7,953 titles across fifteen systems, so "it is a lot of games" was an easy and comfortable explanation, and it was wrong.
Where I thought the time went
An earlier look at the problem had sampled the stack of the UI process and
found its main thread parked in QNX SyncSemWait, with stack words that
resolved into glSwapWindow and RendererOpenGL::swapBuffers. That is a
convincing place to find a thread. I recorded it as "somewhere in graphics
presentation" and started looking at display timing.
The panel offers one mode, 800x480 at 62 Hz. The EGL config reports
minimum_interval=1 maximum_interval=1, so a swap interval of zero is not
available and the frontend's VSync=false setting cannot take effect. Every
frame waits for the display, with two render buffers. Requesting a third from
an eglCreateWindowSurface interposer is refused, requested_buffers=3 rc=-1,
because the buffers are already allocated by the time that call runs.
None of it mattered, which I only found by measuring instead of reasoning. I
put a glFinish in front of the swap so that GPU execution could be told apart
from the wait to display:
GPU execution                61 ms
presentation, eglSwapBuffers  0.3 ms
frontend CPU work            13 ms
Presentation was 0.3 milliseconds. The thread really was sitting in
glSwapWindow, and it was sitting there waiting for the GPU to finish work
that had already been queued. Triple buffering would have bought nothing.
The frame is tiny
Counting what the frontend actually issues, per frame, at steady state:
CC_MENU_DRAW frames=67 arrays=1698 elements=0 vertices=36138 programs=0
             textures=1698 viewports=0 clears=134 framebuffers=0
Twenty-five draw calls. Five hundred and thirty-nine vertices. Twenty-five texture binds, two clears, no framebuffer switches, and no shader program changes meant the GPU was repeatedly executing a very small sequence of already-linked work across the same panel area; there was no post-processing pass, no scene graph explosion, and no draw-call count that could account for sixty-one milliseconds. The cost had to follow pixels.
The second wrong answer
There was an obvious candidate. The theme ships its system artwork at 454x1080,
883 images of it, and 454 is not a power of two. GLES2 accepts a
non-power-of-two texture only with clamped wrapping and without mipmap
filtering, and the renderer was asking for GL_LINEAR_MIPMAP_LINEAR and calling
glGenerateMipmap unconditionally. Every one of those images failed with
GL_INVALID_OPERATION, was deleted, and was requested again on the next frame,
producing 363 failures in one 600-frame run and a tempting explanation for why
the browser appeared busy even when its visible scene contained only a few
system tiles.
Guarding those call sites on a power-of-two check took that to zero. It also meant the artwork now loaded and was sampled without mipmaps, minified by a factor of 2.25, which is exactly the shape of an expensive texture read. I wrote a tool to rescale the whole theme to the panel, 208 MiB down to 72 MiB, and got as far as preparing the card write.
Before doing that I tested the assumption, because the previous one had not survived contact with a measurement.
One variable at a time
I ran five 600-frame passes over the browsing UI, each changing exactly one variable while reusing a preloaded library, and let the frontend drive its own navigation every 400 milliseconds so an operator could not change the pace, selection timing, or controller state between one isolation run and the next.
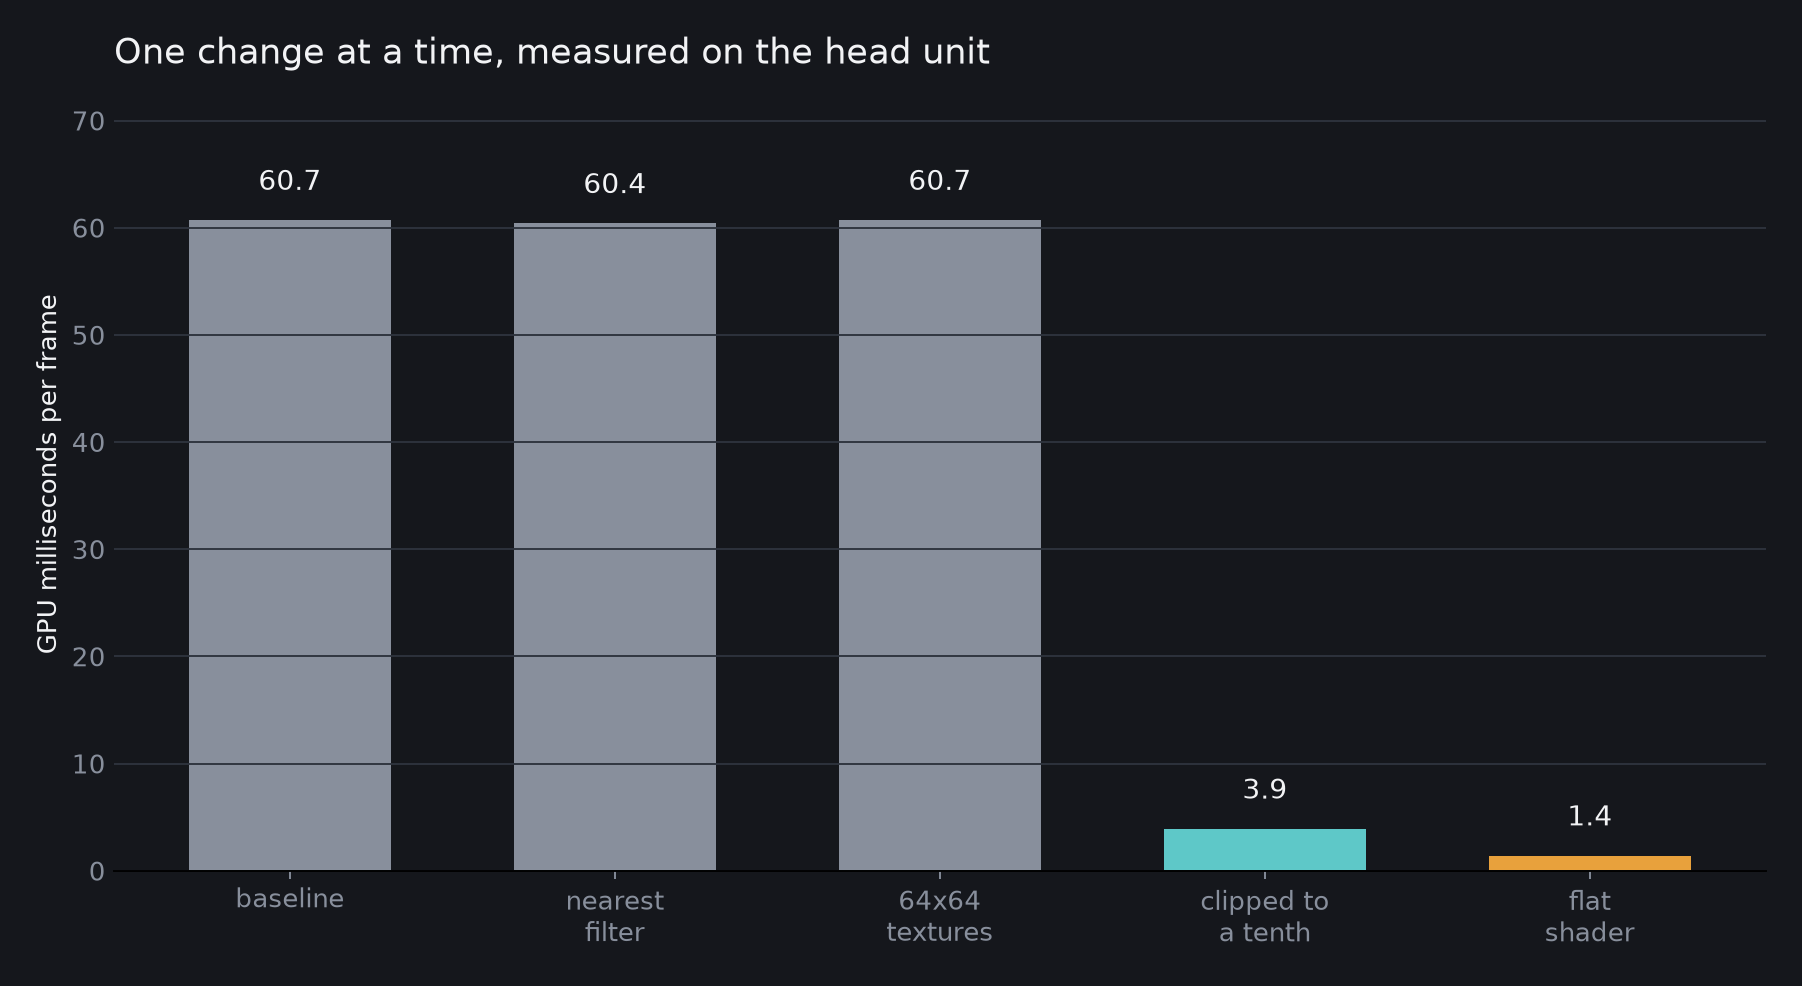
Forcing GL_NEAREST on every texture: 60.4 against a 60.7 baseline. Replacing
every texture larger than 64x64 with a 64x64 thumbnail: 60.7. Texture size and
filtering were worth nothing at all, so the proposed artwork rescale would have
consumed card-write time, altered the theme assets, and reduced visual fidelity
without touching the expensive operation that the isolation runs had exposed.
Clipping every draw to a tenth of the screen took it to 3.9, so cost tracked covered pixels. Replacing the fragment shader with a constant colour took it to 1.4, a factor of 43. The frame was bound by per-pixel shading.
Eight bits, thirty operations
This port targets GLES2, which has no integer or bitwise operations, so the
upstream shader's shaderFlags & 0x20u cannot be expressed. The adaptation
decoded the bits arithmetically:
uniform highp float shaderFlags;
bool hasFlag(float bitValue) { return mod(floor(shaderFlags / bitValue), 2.0) >= 1.0; }
main calls that up to ten times per pixel. A divide, a floor and a modulo per
test, at high precision, on every fragment, read eight bits that do not change
within a draw call; across a 480,000 pixel screen with twenty-five overlapping
quads, that becomes tens of millions of high-precision operations per frame to
answer a question whose result already existed on the CPU before the draw began.
The fix is to answer it once on the CPU and hand the shader the result:
uniform vec4 shaderFlagsLow;
uniform vec4 shaderFlagsHigh;
...
if ((shaderFlagsHigh.y != 0.0) || (shaderFlagsHigh.z != 0.0)) {   // rounded corners
Set beside the other per-draw uniforms:
const auto bit = [flags](GLuint mask) { return (flags & mask) ? 1.0f : 0.0f; };
glUniform4f(mShaderFlagsLow,  bit(0x1u),  bit(0x2u),  bit(0x4u),  bit(0x8u));
glUniform4f(mShaderFlagsHigh, bit(0x10u), bit(0x20u), bit(0x40u), bit(0x80u));
Two uniform calls per draw replace thirty arithmetic operations per pixel. The host suite links all four shader programs and checks 260 rendered pixels across all 256 flag combinations, so the semantics are held still while the cost moves.
What it did
GPU time went from 60.7 milliseconds per frame to 12.4, and browsing rose from 15.2 frames per second to 51.0 without changing the card library, display mode, buffering policy, or the theme's visible layout.
The first number I published for that was 38, and it was wrong in an
instructive way. Every probe after the presentation split still had my
glFinish in it, which serialises the CPU and the GPU: the frame then costs the
sum of the two rather than the larger. 12.4 plus 13.0 is 25.4 milliseconds,
which is 38 frames per second exactly. Removing the drain and re-running gave
51.2 and 50.7 across two windows, so the 38 was a property of the measurement.
Where it stands
The frame now costs 19.5 milliseconds: 13.9 of frontend CPU work and 5.6 waiting to present, against a 16.1 millisecond budget at 62 Hz. It misses one refresh regularly, which is what 51 frames per second is. GPU execution is 12.4 and overlaps the CPU, so the frontend's own 13.9 is the larger half now and three or four milliseconds would lock it to the panel. I have not attributed any of that 13.9 yet.
Lowering the shader's default precision to mediump is the obvious next thing
and remains untried. Substituting it through the preload fails to link on this
driver, and diagnosing a link failure needs a real build's compile log rather
than an interposer.
There is also a bill to pay for the texture fix. Those covers used to fail to allocate and were never resident; now they load, and the first long run from the card ran the GPU out of memory and died with a failed font atlas allocation. The 128 MiB texture cache budget was inherited and has never been validated against what this GPU can actually back. The artwork rescale that was worth nothing for frame rate applies directly to that, so it goes back on the list.
Next is attributing the 13.9 milliseconds of frontend CPU work, lowering the cache budget to something this GPU can hold, and reserving the font atlas so it cannot be starved. The stack samples that sent me after presentation were accurate about where the thread was sitting and said nothing about what it was waiting for.